
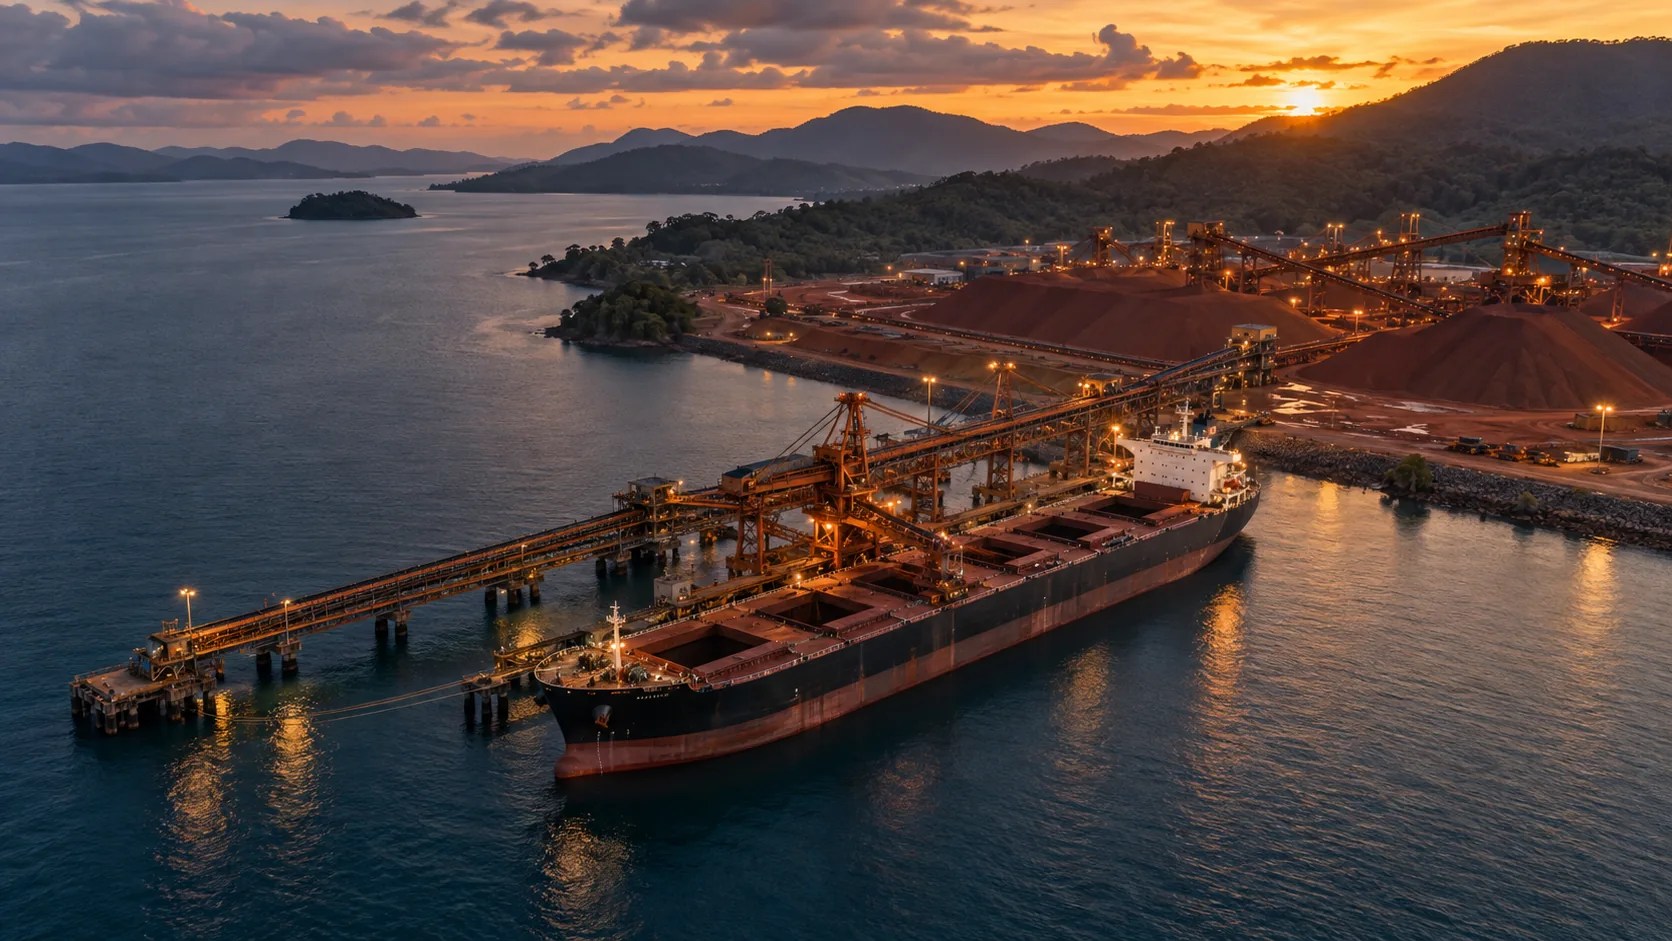
The mineral economy.
The movement behind it.
Worldwide developments from 2019 to 2026, with an Indonesian operating perspective and forward scenarios for fleet, energy and AI investment.
Volume is only one
part of the equation.
Commodity prices, trade routes, processing capacity, power availability and financing conditions can move in different directions. TIN’s analysis turns that complexity into practical choices about fleet size, lease duration and infrastructure sequencing.
The timeline describes industry developments, not a claim that TIN delivered projects in every year. The right-hand column is TIN’s planning interpretation.
The baseline begins to shift
Indonesia’s raw-material restrictions and domestic-processing policy became a major trade issue; the EU requested WTO consultations in November. [1]
Planning implication
Map where material will be processed, not only where it is mined. Test domestic and export routes.
Disruption becomes an operating variable
The pandemic interrupted industrial demand. Global coal demand fell 4% in 2020 in the IEA’s assessment. [2]
Planning implication
Build downtime, workforce continuity and alternative transport arrangements into the operating model.
Rebound and capacity pressure
The IEA’s 2021 review anticipated a strong coal-demand rebound as economic activity recovered, illustrating how quickly utilisation assumptions can change. [2]
Planning implication
Use staged fleet mobilisation and flexible equipment access to match confirmed volumes.
Energy costs enter the foreground
Thermal coal prices reached record levels during the energy crisis associated with Russia’s invasion of Ukraine. [3]
Planning implication
Assess energy-price exposure alongside transport revenue; avoid sizing long-life assets around peak prices.
The battery-mineral correction
Battery-material prices weakened after the 2021–2022 surge as new supply expanded. [4]
Planning implication
Stress-test lease coverage and working capital against weaker commodity prices and lower utilisation.
Demand growth, different price signals
Nickel, cobalt, graphite and rare-earth demand rose 6–8%, while nickel, cobalt and graphite prices fell 10–20%. [4]
Planning implication
An expanding market still rewards disciplined cost per tonne, maintenance and queue management.
Concentration and capital discipline
The IEA reports that critical-mineral investment fell 9% in 2025. Indonesia remained the leading source of recent nickel-refining supply growth. [5]
Planning implication
Prioritise serviceable assets, selective automation and delivery structures with clear counterparties.
Resilience joins efficiency
The July 2026 IEA outlook identifies renewed price pressures and disruption risks, including sulphur supply affecting mineral processing. Indonesia’s 2026 GDP growth was projected at 5% in June reporting on the World Bank outlook. [5] [6]
Planning implication
Coordinate inbound consumables, outbound minerals, energy procurement and fleet scheduling. Treat annual 2026 figures as incomplete.
Fewer exports can mean
a different fleet requirement.
IEA Coal 2025 estimated global coal imports falling around 5% in 2025, with Indonesian exports down almost 50 million tonnes. These are coal-trade figures, not a measure of all mineral transport. [3]
For TIN planning, tonnage, distance and handling stages must be modelled separately. Domestic mine-to-smelter corridors, mine-to-port routes and inter-island transfers place different demands on trucks, stockpiles and terminals. A longer route can require more fleet capacity even when tonnes are unchanged.
Different commodities.
Different transport decisions.
| Market | Verified signal | TIN planning interpretation |
|---|---|---|
| Coal & bulk haulage | IEA Coal 2025 forecast global coal demand about 3% lower in 2030 than 2025, while Southeast Asian demand grows more than 4% annually. [3] | Distinguish domestic customers from export customers. Align lease terms with contracted throughput and test resale or redeployment options. |
| Nickel & downstream processing | Indonesia is central to refining growth; supply concentration and processing-input risks remain material. [5] | Coordinate ore delivery, reagents, industrial-park access and port windows. Model wet-weather buffers and payload compliance. |
| Copper & electrification | The IEA 2026 base project pipeline indicates a potential 25% copper supply gap in 2035 against STEPS primary requirements. [7] | Plan infrastructure lead times and commissioning interfaces. A global supply gap does not establish revenue for any specific haulage project. |
| Electric trucks | Electric trucks reached 9% of worldwide truck sales in 2025; IEA current-policy projections reach at least 20% in 2035. [8] | Road-truck trends are not direct proof of off-highway mine suitability. Validate payload, gradients, duty cycles, charging and parts support. |
Plan for opportunity.
Design for uncertainty.
The IEA’s 2026 Stated Policies Scenario projects critical-mineral demand almost doubling by 2040, with lithium more than tripling and nickel, graphite and rare-earth demand growing by roughly 50–90%. These are scenario outputs, not assured shipments or TIN revenue forecasts. [7]
| Horizon | TIN service opportunity | Decision gate |
|---|---|---|
| 2026–2027 | Feasibility, asset leasing, dispatch visibility, energy baselines and focused EV or robotics pilots. | Confirmed customer demand, site access, power study and measured pilot results. |
| 2028–2030 | Staged fleet replacement, depot electrification, managed haulage and edge-compute integration. | Route-level economics, maintenance capability and bankable operating contracts. |
| 2031–2035 | Portfolio fleet management, integrated energy optimisation and broader industrial automation. | Demonstrated reliability, lifecycle cost and suitable local deployment conditions. |
TIN service opportunities above are our qualitative planning scenarios. No fleet order book, market share, financial return or deployment commitment is implied.
From market signals
to operating choices.
Sources & methodology
Publications are identified below so readers can locate the original material. Figures retain their publication date and scenario basis. Full-year 2026 actuals are not yet available. Market statistics and TIN’s operational interpretation are presented separately.
- WTO — DS592: Indonesia — Measures Relating to Raw Materials. Consultations initiated November 2019; dispute chronology and measures.
- IEA — Global Energy Review 2021 — Coal. 2020 decline and the 2021 rebound outlook; historical vintage.
- IEA — Coal 2025 — Executive summary. 2022 price context, 2025 estimates and forecasts to 2030.
- IEA — Global Critical Minerals Outlook 2025 — Executive summary. 2023–2024 supply, demand and price developments.
- IEA — Global Critical Minerals Outlook 2026 — Executive summary. Published July 2026; 2025 investment and current supply-chain risks.
- Reuters / World Bank outlook — World Bank says Indonesia’s GDP to slow to 5% in 2026 as fiscal pressures rise. 11 June 2026. Secondary reporting; full-year projection, not an actual result.
- IEA — Global Critical Minerals Outlook 2026 — Outlook. STEPS projections and announced-project supply comparisons.
- IEA — Global EV Outlook 2026 — Executive summary. 2025 truck sales and current-policy projections to 2035.
This is general industry research and commercial information. Project feasibility, asset performance, regulatory requirements and commercial terms require project-specific verification.

